Introduction
The paradox of computers is that they seem to be able to do something of everything and yet nothing fully. Computers have assisted people in thousands of applications, yet computers have not been able to fully replace people in any but the simplest applications. One area of application, computer mapping, illuminates both parts of this paradox.
Computer cartography is a significant portion of the large industry of computer graphics. Companies and government agencies as diverse as the CIA and your local gas utility are major users of computer cartography. It is estimated that in the petroleum industry alone, over two thousand maps are produced by computers worldwide each day. Computer maps are produced by the Census Bureau to show income distribution and population; the New York Times evaluates its markets with computer maps; defense agencies use computer maps to guide missiles and simulate battles; local governments and planning boards update their maps by computer; and utilities use computer maps to simplify their extensive service maps. The combination of computers and maps occurs more frequently as time goes by. The future may allow personal computer users to customize and produce their own unique maps at home. Such maps could range from simplified world maps to detailed maps of local bike paths.
Computers have affected cartography in three major ways. One, they have aided in the basic production of maps. Maps can be produced partially or wholly by machines. There are certain problems which will be discussed later, but, on the whole, computers can reproduce any map. This assistance has made maps more widely available and has led to maps being used in places where they would have earlier been considered extravagant. Two, using computers has changed the way people examine, create, judge, and use maps. Using computers for mapping has altered the use of maps themselves. Computers even provide new ways of evaluating maps. Three, new uses of maps and the newer definitions of mapping threaten values we hold today, particularly privacy. Cartography may not be a benign discipline.
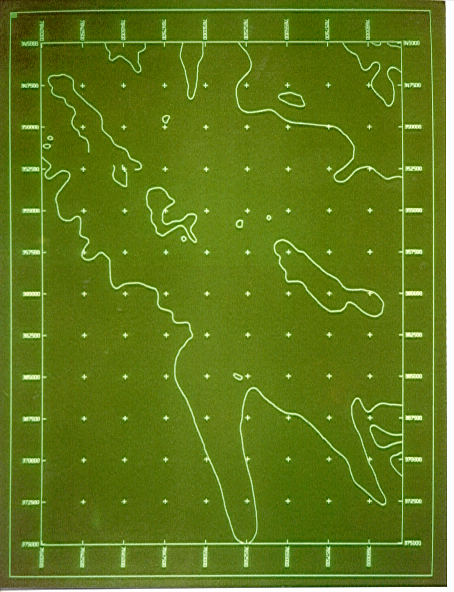
State of the Art (1983), picture of a Tektronix 4014 screen.
The Computer Revolution
The increasing use of computing machines is the most heralded change of the second half of the twentieth century. Although the trumpet of change sounds loudly, certain problems elude the call better than others. The early applications, for which computers were developed, were strictly numerical. Computers had to compute. Throughout the 1960’s and 1970’s more non-numerical uses were found. In the fourth generation of computing, the 1980’s, personal computing, expert systems, and artificial intelligence are the hardly recognizable descendents of the number-crunching applications deemed their ancestors. Nevertheless, all uses of computers remain, ultimately, numerical uses.
In short, computers only represent objects which people or programs have described to them in numbers. Computers only operate on numbers, hence, all operations, from wordprocessing to choosing an airline ticket, are for them operations upon numbers. It is natural then that problems which are numerical, or easily represented numerically, are the first problems solved by computing machines. It is also natural that problems too complex for people to easily describe numerically are solved last. This is why computers can multiply thousands of numbers a second without error, but still cannot automatically correct a misspelling.
Representing problems numerically can be seen as a theoretical problem with a probable solution in most cases. Still, practical considerations are important. Certain problems can be solved in theory, but not in reality. Practical constraints, such as the amount of storage or speed of the processor, can render solution of problems impossible or improbable due to the time or resources necessary to solve them.
Computer Cartography
Cartography is a discipline of contrasts. On one hand, cartography is an exacting, scientific discipline requiring very precise numerical answers. Cartographers pursue an unattainable goal of absolute accuracy. On the other hand, cartography is an art. There are good cartographers and bad cartographers. Despite the fact that both good and bad cartographers may work with the same data or achieve the same precision, maps are subjective representations of reality. Representations of locations are subject to evaluation by people who will compare their values with the map maker’s values.
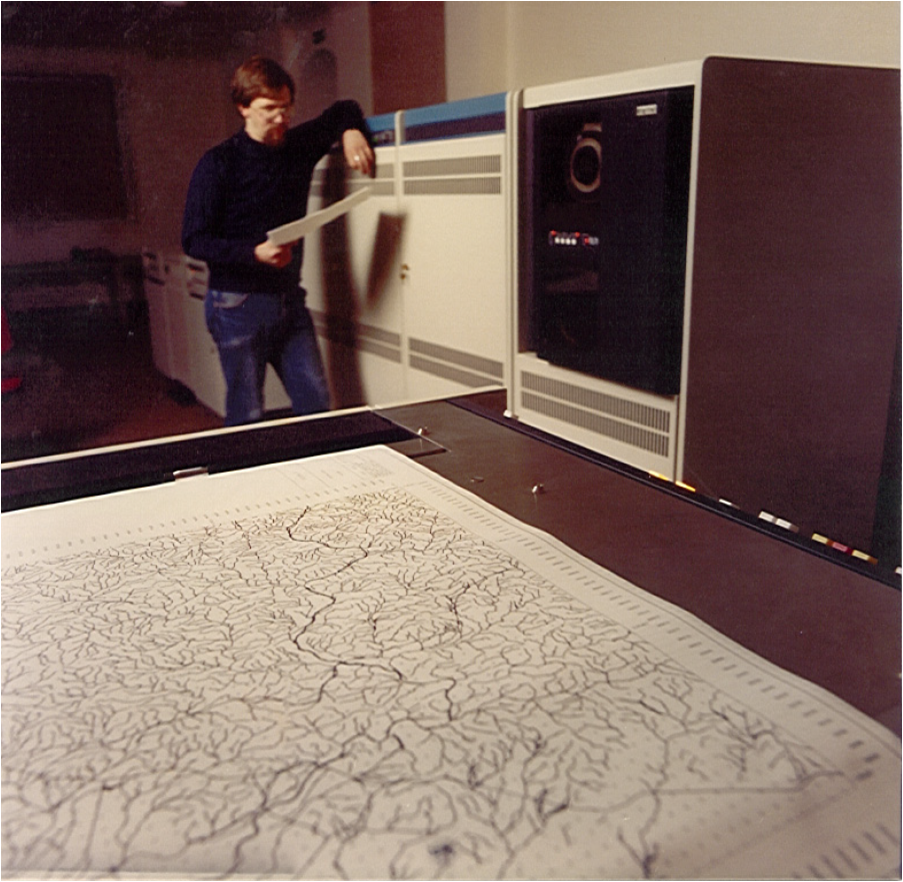
Petroconsultants (Computer Exploration Services), Cambridge, England (1983), computer room with VAX in background and Versatec 44 inch plotter in foreground
Naturally, computers were first applied to the numerical aspects of cartography. Physical maps can be considered mathematical ‘maps’. A three-dimensional world is `mapped’ (projected) to a plane: (x, y, z) i (x’, y’). Time sequences of populations (four dimensions) are ‘mapped’ onto a flat surface. Map projections are numerical functions easily calculated by computers, while manual calculations are time-consuming. Today, virtually all strictly numerical cartographic operations are performed by machines. These operations include adjustment of triangulations, datum shifts, scaling, coordinate transformations, great circle measurements, and area calculations. Seeing maps as mathematical representations of the world is a prerequisite for performing these operations.
As symbolic representations of the world, maps boggle computers. Computers can scan and store exact images of maps, and with computer-controlled devices like plotters and scribers, computers can produce maps. But computers cannot interpret the images they plot or scribe as anything other than a duplicate of what they originally scanned without more information and extensive software to utilize the information. Given raw information, they are not aware of a map’s meaning. A line is not considered a road, or even a line, simply a sequence of numbers or discrete dots. When features on a map are given symbolic representations, e.g., a person tells the computer that a red line represents a road, or that a particular dot and associated text represent a city named Poughkeepsie, it is possible to use the computer to perform selective plotting not capable with unexplained raw input, for instance, plotting only cities adjacent to a road. Interpreting and representing maps as humans do is well nigh impossible at present, but it is a goal of computer cartographers.
There are many advantages in using computers for cartography. Computers can take the data they have stored and plot it at a variety of scales very quickly. They can simplify and generalize the information so that a small map of the world does not need to contain all of boundaries or detail within the world’s countries. They can amplify, by interpolating and smoothing, in order to produce maps far larger than the data originally warranted. They can quickly alter the appearance of maps – one time plotting roads in red, the next time plotting roads with black dashes. Computers can update and correct maps quickly, because the specific information can be altered and the entire map redrawn in a matter of minutes. All of this adds up to the easy production of maps far faster than traditional draftsmen can work, for the one time input of a cartographic database.
The History of Computer Cartography
The historical problems of computer cartography are with us today. The very first numerical uses of computers indicated that tedious projection calculations ( e.g., transforming survey locations to a Mercator projection) would be simplified, but the first implementations also indicated that there would be difficulties. In 1963, Ivan Sutherland developed a graphic display program for his doctorate at M.I.T. called “Sketchpad”. This aroused interest in computer graphics in general, and pointed the way to later computer production of maps.
That the history of computer cartography is primarily a history of governments and defense should not come as a surprise. Cartography has been bound with war since the first battle plan. The initial impetus for mapping in most countries has been military, as attested by the names “Ordnance Survey”, and “Admiralty Charts”. The armed forces have vast quantities of information that computers can use, e.g., sonar depth tracks. Armed forces have a particular need to arrange their cartographic information for swift retrieval and updating. In today’s world, the U.S. Defense Mapping Agency has the most modern computer cartographic center.
While the most immediate use of computer cartography has been defense, intelligence agencies have been just as busily applying computers to their mapping problems. In the early 1970’s the Central Intelligence Agency was the first organization to compile a comprehensive database of the world. This database was called the World Data Bank and contained over six million points. Containing only water bodies and political boundaries, the World Data Bank was useful at scales from I:1million to 1:5million. During the same period, the Census Bureau compiled a more detailed cartographic database of the United States showing their census tracts and Standard Metropolitan Statistical Areas. Both of these databases were available to the public and widely used. However, creating them was prohibitively expensive and demonstrated a fundamental problem of computer cartography; large, hard-to-construct databases are necessary to make maps. The last major governmental impetus for computer mapping was from resource management agencies, such as the Forestry Service, Department of Agriculture, and state agencies which manage parkland, water, or minerals. These agencies carried out extensive surveys which they wanted to integrate with other databases of land use and resources. Resource management agencies constructed their own databases or combined databases, especially combining them with computerized information starting to be supplied by national mapping agencies e.g., the United States Geological Survey.
Within the private sector, computer cartography advanced in universities, utilities, transportation companies, and mineral companies (primarily oil firms). Universities were intrigued by the unique problems of graphics and cartography. Important contributions came from laboratories at M.I.T., Harvard, Utah, and Edinburgh University, to name some of the more important research centers. Each university made contributions to specialized hardware or software which simplified the problems specific to mapping. The utility industries, gas, telephone, and electric, frequently revise databases of their services and began to contribute new applications and research. Their databases changed frequently and were best displayed as maps. Thus, utilities investigated many updating problems of computer cartography. Transportation companies, especially railroads, needed extensive mapping services to reflect the changes in their networks. Another major private sector input was from the mineral companies. Most particularly, oil companies needed mapping to describe their far-flung reserves, potential reserves, and to plan new exploration. Oil companies combined new computer techniques in seismic exploration and mapping to develop cornrehensive cartographic capabilities and specifically developed many of the standards for map accuracy and estimating error. The private sector focused on presenting computer map data with spatial (coordinate) data that was already being used by computers in another application. Today, the latest commercial use of computer mapping is in marketing, where marketeers evaluate potential markets and market penetration using computer produced maps.
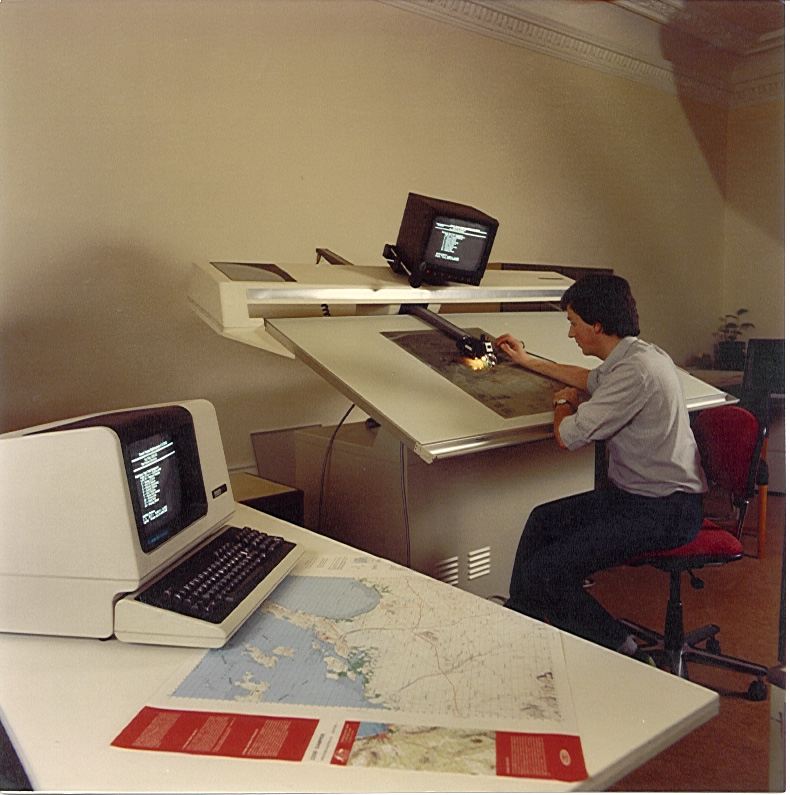
Laser line-following digitiser designed by Geodat team (1983).
Satellites and Mapping
A near revolution in cartography came from the flood of data provided by satellites. The interpretation of sensor data from satellites (remote sensing) has produced some astonishing results in the last decade, but these results fall short of the expectations which many experts in remote sensing held. Since space travel became available in the late 1950’s, scientists have used space to learn as much about the earth as they have about the outer reaches of the universe. Pictures of the earth, meteorological satellites, and the latest earth resources satellites have had the study of earth as their function, not the study of the moon, the planets, or the stars.
The most important series of earth-studying satellites has been the U.S. Landsat series: Landsat-1 (1972, also known as ERTS), Landsat-2 (1975), Landsat C (1980), and Landsat D (1982). Similar satellites have been scheduled for operation in the next three years by France and Japan. The scanning device contained in these satellites has been a Multi-Spectral Scanner, MSS for short. An MSS is capable of recording the electro-magnetic energy which falls on it when it is pointed at the earth. There are also plans for a Thematic Mapper (TM) with increased resolution, but the TM in Landsat D failed before it could be fully evaluated.
The Landsat D satellite orbits the earth once a day, roughly from pole to pole, recording data in a 185km wide swath. The entire area covered is divided into 80 meter squares, known as pixels, for ‘picture element’. Thus, most of the globe is represented by pixels showing primarily the reflected sunlight of a pixel at a certain time, which in turn indicates what features are contained in the area represented by a pixel.
The MSS data is relayed to earth and distributed at a nominal charge in the U.S. through the Eros Data Center in Colorado. Because the data is cheap and readily available, Landsat results have been used widely. Agricultural yield estimation, crop disease detection, mineral prospecting, resource evaluation, and discovery of new lakes in Colombia are some of the remarkable things which have been achieved with the data. Having interpreted the area using procedures common to aerial photography, the computerized data can be used to produce statistics or it can be combined with other computerized data for composite analyses. These results are achieved by using the Landsat data to make photographs or maps of the areas under consideration. All analysis depends on making maps from the data and there are problems.
Landsat users have received both less and more than they bargained for. On one hand, the data has been voluminous, so much so that the amount needed to produce even a single map requires large amounts of computer storage, processing time, and special programming if maps are going to be produced on a regular basis. Special processing requires special computers, generally high-volume, high-speed graphic computers known as image processors. On the other hand, totally automated mapping of Landsat data has eluded researchers despite vast efforts on their part and hefty bank balances on the part of firms selling image processors. Progress has been such that the U.S. Geological Survey has produced detailed 1:200,000 scale maps of test areas, but a large amount of manual interpretation has been necessary.
The most immediate problem has been accurately locating what the MSS has scanned. The satellites wobble a bit in orbit and so they are not necessarily looking straight down. An interpreter must determine specific known points on the image (tiepoints) and use these to correctly position the rest of the data (rubber-sheeting). In the future, better instrumentation will give increased accuracy. However, in the present, the rubber-sheeting necessary for accurate interpretation is time-consuming, in both human and computer time.
A second large problem has been classifying what each pixel means. Each pixel is a sometimes confusing conglomeration of different spectral readings. For instance each pixel can contain a variety of features all jumbled together; houses, cars, roads, trees, and water features can all meet in one place. Clouds can obscure part of the picture. In different seasons snow or leaves or flooding blur the picture. Furthermore, as any pilot would agree, recognizing many features from above is difficult under the best of circumstances. In addition, features that people find important, such as the only road within 200 miles in central Brasil, may not be apparent to the satellite. Some progress has been made: in one specific case, oil companies can identify varieties of surface plants and use characteristic plants to locate oil-bearing rock below. However, progress is slow in categorizing the data accurately on a large scale.
In theory, an accurate up-to-the-minute map of town-as-it-looked-last-week is possible and such map production is a goal of researchers. Some hope to achieve a Star Trek-like computer response, “Captain, sensor readings indicate a newly constructed bypass ahead”. In the pursuit of modernization, cartographers are changing some of their old methods for use with computers and using Landsat data to produce some maps. Despite the computerization, annotation is only semi-automated, simple maps need lots of expensive processing, and conventional maps and surveys are required for accurate identification of ‘cultural’ features and tiepoints.
All this work has resulted in a thirst for more data. Users would like more coverage and more detail. There has been talk of 10 meter square pixels, which could result in maps at scales of 1:20,000. Governments are considering the effects on privacy; you can almost count individual automobiles at such scales. Governments are also considering the cost. To date, the U.S. has provided much of the funding and both the U.S. and resource management agencies have benefited in assessing their domains. Nevertheless, the U.S. government questions the need and usefulness of Landsat, data with better resolution. French and Japanese satellites will give a closer look, but users are worried that the data may not be freely available.

Close-up of head of laser line-following digitiser. Laser hits map and goes back to photoelectric cells. Gain from cells drives feedback to stepper motors to reposition the head to stay in the centre. The feeling was as if you were a needle following a phonograph groove. For a skilled operator, this meant that a complex bathymetric or topographic chart might take a day to digitise rather than one to three weeks.
How Computer Cartography Differs from Other Computer Applications
Having seen the background to computer cartography and the effects of new satellite information, we can examine specific differences between cartographic applications and other computer applications. Computer cartography, and computer graphics in general, differ from other uses of computers in two major ways. The first difference is that the volume of data is astoundingly large. To store a simple map of the United States showing the outlines of the states, requires a minimum of six hundred points to be recognizable, two thousand points to look decent, and can reach up to twenty thousand points without difficulty. Ignoring the overhead, this means a significant 160 kilobytes of storage are required to store and use a relatively simple map. More complicated maps can easily need ten times more space. Also, unlike other applications, cartographic transformations must be performed on all of the data, regardless of the relative interest of particular portions. An entire map needs to be projected, not just the portion which is going to be used. If you want to plot Massachusetts surrounded by the other New England states, you must work on all of the data for New England.
The second difference is that in graphics and cartography the data used is spatial data, not tabulated data. Unlike typical computer applications, say, maintaining inventories, maps combine mathematical transformations and database manipulations. The information looks different every time it is displayed, but contrary to perception remains the same data. Dealing with spatial data involves two different problems. First, the data needs to be rotated, projected, scaled, etc. These are computationally-intensive mathematical transformations which are to some degree dependent upon the data being transformed. For instance, different mathematical projections are used in different countries to give the best results for that country’s location, size, and shape. The particular use of the map is also important. A map projection good for navigation is not a projection good for assessing population distribution.
Second, in addition to the above, the data also needs to be manipulated in a traditional database fashion, i.e., a user needs to retrieve the data by attributes. But this retrieval is not as traditional as it looks. Asking for a combination of spatial characteristics involves different calculations than asking for a combination of names and addresses. As an example, a person could want to plot a map of all the rivers in Wisconsin. To be able to do this, data needs an attribute describing what type of feature it is (city, river, lake, road, railroad, boundary…) and the data must be stored in such a way that all data is associated with a state (this river is a river in Wisconsin). If the data is not associated with a state, then the computer will need to establish what is Wisconsin (a boundary outline) and determine whether the river is within Wisconsin, and if so, totally or partially within it – another lengthy calculation. Obviously, any manipulation is compounded by the first problem, the amount of data, which means that people may wait a long time for results.
The differences between computer cartography and other computer applications are demonstrated by asking a computer database of the United States, Where is Poughkeepsie? The answer to such a question immediately requires an extensive database holding as a minimum most cities in New York State. The answer also requires a new way of dealing with data. To get the answer, the computer must deal with the data spatially. Does the user need coordinates in latitude and longitude, does he need a represention on a general map of New York or the United States, or does he require coordinates in some national grid system, for instance United States Geological Survey coordinates? Other questions which can be usefully asked are: How far is Poughkeepsie from Albany? What is the area of Poughkeepsie? What is the nearest railroad to Poughkeepsie? What county is Poughkeepsie in? These questions differ from traditional ones asked of employee or inventory databases. These questions deal with the spatial characteristics of the data. People process spatial information easily. If a person looking at a map is asked whether or not Poughkeepsie is close to Albany, he will respond quickly and without much thought, because he can easily glance at a map and evaluate distance and use the evaluation to judge the relative value of ‘closeness’. Just posing the problem to a computer is difficult.
Two Basic Approaches – Raster & Vector
At the heart of computer graphics, and thus of computer cartography, are two distinct ways of storing and handling data – the raster method and the vector method. These two distinct methods are an outgrowth both of different philosophies and of different technologies. Simply put, the raster method is a brute force approach of dealing with data by computer, while the vector method is an attempt to make computers deal with data as humans do. Both approaches have their positive and negative aspects. The use of one approach determines the kinds of manipulations that can be performed upon the cartographic data.
The raster approach developed from the way in which computers initially handled changing images. Changing images were stored on a screen similar or identical to a television screen. These screens were divided into lines and the lines into rasters. Rasters are to all intents the same as pixels. The raster approach is a way of managing data in a fashion computers find acceptable. Landsat data is in a raster format. One advantage of the raster approach is that less interpretation is carried out between acquiring the data and displaying the data; what you see is what you have. Another advantage of the raster approach is that the basic operations upon the data are simple and the concepts are easily understood. The ‘map’ is a series of cells holding a value corresponding to a value of the cell in the real world. People most often want to ‘zoom in’ on a portion of the data or enhance a particular area. If people want to `overlay’, i.e., combine, two databases of the same area, they can just combine the appropriate pixels with each other.
However, the raster approach is not a cure-all. To store a map with a few different values for an area takes just as much storage as a map with many different values for the same area. The choice of pixel size is crucial in determining at what scale the data can be effectively used. If the chosen pixels are too small, there is a large overhead in processing each pixel. If the chosen pixels are too large, the data at best looks bad, and at worst is unusable. Pixels used to draw a line at an angle to the pixel grid exhibit the ‘staircase effect’. The ‘staircase effect’ is seen when a line that people feel should be straight, say northwest to southeast between two cities, has been represented by square pixels which can only represent the line as whole squares. The resulting picture looks like a jagged string of squares when it should look like a straight line. It is similar to trying to copy the Mona Lisa by coloring in a checkerboard. You can copy the painting adequately with small enough squares, but you have to use invisibly small squares to make the jagged edges invisible. Finally, combining pixels of one size from one database with pixels of a different size from another database is a complicated task subject to a large degree of interpretation.
The vector approach tries to imitate the way humans deal with pictures and maps. People draw lines. The vector approach simulates all of the complicated lines drawn by people with straight line segments – `vectors’. As an example, a circle is represented by a polygon, i.e., a large number of vectors forming a polygon, say forty or more, appear virtually the same as a circle. The vector approach is more attuned to the way people actually work. Although people feel that a circle is continuous, physically drawing a circle requires a large number of short segments. To change a line drawing of a house, people think of increasing the roof height by moving the junction of the two lines at the apex to a new, higher apex. Thus they think of a vector operation, moving lines, rather than thinking of a raster operation, moving all of the pixels making the two lines.
While vector data is the way people draw data, transformed vector data may not have the same characteristics as its source. For instance, the boundary of the U.S. with Canada is along a line of latitude. On some projections this line is curved (Lambert Conic Conformal), on some straight (Mercator). If the original vector data was in latitude and longitude and merely stored the endpoints of the Great Lakes and Washington State, when used in Lambert Conic Conformal, there would be a straight line between the projected endpoints of the Great Lakes and Washington State, instead of a curved one. The vector approach does save storage space and represent certain features better than rasters ( e.g., circles, sine curves) but at the expense of completeness and sometimes greater computation requirements.
The two approaches tend to be exclusive of each other, although there are methods of converting between the two. Conversions between raster and vector tend to be computationally intensive and are not yet practical for large databases. Until recently, the vector method predominated in storing and handling data. Raster devices were prohibitively more expensive and required more of that expensive storage. Also, very little data was in raster format. People traced maps as they would if they were drawing them, i.e., using vector techniques. With the decreasing cost of computer hardware and memory, and the easy availability of raster data (Landsat), raster devices have become as common as vector devices.
The vector approach is still an important one, and it should be noted that it is still the preferred method of storing databases for most applications because it uses less storage. The production of both raster and vector databases is difficult and tedious. Expensive equipment is still necessary to accurately scan maps and produce detailed images in a raster format. Producing vector databases is very labor-intensive. People must trace, in detail on a digitiser, every vector used to create a cartographic database. If you can imagine the detail and number of different types of features on a typical topographic map, you can imagine the length of time necessary to input a single map. Because of the large expenditures both methods require, countries like the U.S. will not be covered by detailed, comprehensive cartographic databases at topographic scales of 1:25,000 until the next century.
The Impact of Computer Cartography
It would be hard to find a less controversial topic than computer cartography. To most people it is simply another “gee whiz” application of computers. On the surface, the only socially significant aspect is the possibility of rising unemployment among cartographers. However, when examining computer cartography as an all-embracing discipline which relies upon computers and satellites, we can discern trends that may affect the man in the street.
The easiest point to establish is that there is a steady trend toward greater map production, and the man in the street is going to be exposed to more maps than ever before. Just as computerized listings from databases have inundated us with information, computerized maps are starting to be produced in floodlike proportions. In the past, a large number of highly-skilled cartographers produced a relatively small number of maps. Today, once the cartographic database has been created, an infinite number and variety of maps can be made. Greater exposure to maps will require the man in the street to be better informed about their meaning. Maps are useful media for propaganda – take a look at the widely different sizes of the U.S.S.R. on different world maps. Formerly, cartographers were trained to evaluate maps to avoid misinterpretation. They avoided certain color combinations, used standard symbols, and adhered to high standards of accuracy. Because many non-cartographers now produce their own maps, the old standards are not used. The computer can give a false aura, of accuracy and people can be deluded into believing that a flashy computer map is a good map. Greater map production does not mean better maps.
A second noteworthy point is that computer cartography will change our basic notion of a map. Already, satellite data is often considered map data. Because people will be using raster methods, they will stop thinking of maps as lines on a piece of paper and start thinking of maps as an array of cell values in computer storage. The nightly television weather broadcast displays computer produced meteorological maps which are a combination of satellite photos and boundary maps. Such composite maps are becoming more common. With the addition of labels and grid markings, Landsat data is often used as a substitute for a map. Previously, cartographers interpreted everything they placed on a map. For instance, roads on highway maps are up to a mile wide, if they are measured strictly according to the scale. Obviously, this type of enhancement is important, because if roads were drawn to scale, they would hardly be visible, in some cases a pen width would be too wide. Interpreted maps are useful summaries of the world, while raw data from satellites can give detail where it is need. A balance must be struck between interpreting data and dealing directly with basic data.
A third point to note is that creative uses of maps will increase. By freeing people from the labor-intensive parts of map-making, computer cartography has encouraged experimentation in maps. Such experimentation has changed some notions of maps and created new notions: three-dimensional representations of population are no longer time-consuming; the Census Bureau has developed a new method of displaying tract values as mixtures of different color; and statistics are as frequently mapped as tabulated. Cartographic databases permit us to give information previously devoid of (x, y) coordinate content a spatial component. An address is no longer just a label for a mass-mailing, it can be used to calculate the density and distribution of the mass-mailing. Plenty of information which has been thought of as strictly numerical or textual will now be tied to coordinates in the world, and thus will be mappable. Although we are unable to forsee the future, it can surely be stated that change is inevitable and will increase.
The fourth point should warn us that another piece of technology will reveal its two-edged character. Personal privacy will diminish with two cutting advances in computer cartography – increasingly detailed data and increasingly sophisticated data manipulation. Satellites will provide the better detail. Although most satellites are designed for peaceful purposes, everyone has heard of their military potential. The information is classified, but sensitive and sophisticated military spy satellites are probably capable of distinguishing at least 0.3 meter pixels. This allows individual people on the earth’s surface to be tracked. During the day they can be tracked with visible light, while at night they can be tracked by infrared spectral readings. It is not paranoically Orwellian to imagine an extensive series of geostationary satellites and computers providing information about the exact location of everyone on earth and recording their every action. Despite the positive potential of crime prevention, there exists a serious potential for abuse. Even the relatively low resolutions used today produce complaints from farmers who are unable to conceal the cash potential of their crops from outside evaluation.
Satellites are not the only source of detailed cartographic information. Other detailed databases are being constructed today. Used in combination, databases of addresses, zip code boundaries, county plans, and housing plans, can be used to invade privacy. Sophisticated data manipulation is being built into today’s hardware and software. A good bit into the future, a credit company could, in theory, evaluate a person by taking only his address and use it to access databases so the company can count the cars in his parking lot, examine his house plans, check all deliveries to and from the address, and take note of the comings and goings of people, perhaps even following them to their addresses.
It is generally agreed that people have a right to privacy. Although techniques, from electronic ‘bugs’ to bulldozers, exist for violating that privacy, such techniques are illegal. Satellite data has been virtually free, yet restricting the data or making it illegal to use could result in more concentrated abusive power; how will the potential abuse of detailed databases be curbed? The potential benefits of such databases must be balanced against their harmful effects and a solution found that will keep the equilibrium.
It is a common problem with technology, from genetics research labs to teflon-coated cookware, that the application of the technology has its dangers. However, there is a distinction between global effects and local effects. A person chooses to purchase teflon cookware or through negotiations a genetic research lab and local residents choose a site to build labs. In both cases the effects are local and people have some choice. Nuclear weapons have a potential for global effects and the people affected have little choice in participating. Detailed cartographic databases and the manipulation of spatial data are the last links necessary to make the effects of information abuse as global as weaponry. Although theoretical abuses will remain theoretical without extensive software and hardware development, this development cannot be effectively regulated, and on the contrary, will expand because of the push for benevolent uses alone.
The fifth and final point to be made is that the volume of information computer cartography will soon make available will reveal new ways of looking at the world. Just as the rapid development of mapping during the age of colonial expansion fostered a world view of events, the new cartography will shrink the world and once again reshape our conceptions of the world. The recent timely interpretation of world-wide deforestation has only been possible with new cartographic overlays showing up-to-the-minute forest cover. We can almost hear, “Captain, last year Burma lost 275 square miles of dense forest”, and this statement may prompt us to do something about it. Our planet could become a better place because we will know more about the earth and how we change it.
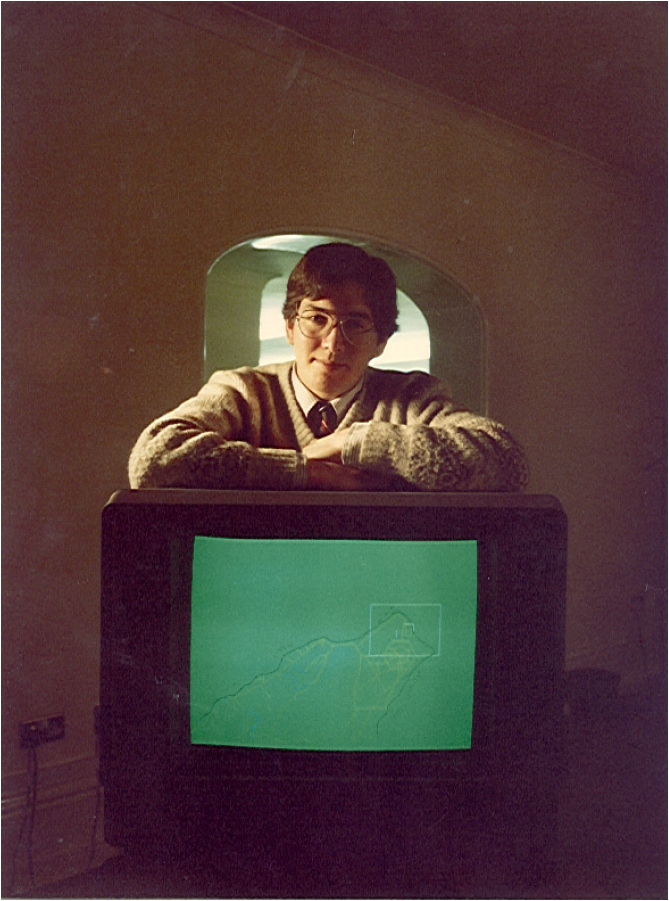
Proud Director of Geodat Project (and author) with state-of-the-art colour Tektronix 4027 colour screen, Petroconsultants (Computer Exploration Services), Cambridge, England (1983).
Conclusion
We have seen that, despite some unique problems of volume and spatial orientation, computers can produce maps. These problems will diminish in time, and computer maps will be extremely common. Our ideas of map use will change and new uses will appear. Unfortunately, cartographic databases and techniques can tie data together in harmful ways. Lastly, the sheer volume of maps, where previously they were few or unavailable, will provide new insights and interpretations of the world.
There is no simple way of getting only the good returns from the expansion of mapping and databases. If the data is strictly controlled, there is the risk of misuse by the controlling agency, probably a government. If the data is freely available, we will have to change our basic concepts of privacy. Thought may become the last bastion of personal privacy in a shrinking world. For clues to action, we should look at the last major historical database creation, the census. This data has great detail rendered harmless by secure anonymity. If new databases can be secured for individuals in the same way as census databases are, perhaps a pragmatic solution can be found for privacy. Future computing progress will develop mapping further and produce benefits, but even this seemingly benign technology has implications in the year of 1984.